Graphical and Tabular Role Visualizations
Did you know that Oracle offers a convenient way to view the privileges, roles, and users assigned to a role without having to navigate through multiple clicks? You can choose between two formats for role visibility: Tabular and Graphical. Personally, I prefer the Tabular format for its clarity and ease of use.

In the Security Console’s Roles tab, you can explore role hierarchies in detail. Depending on your preferences, you can choose between a tabular or graphical representation of the hierarchy, the default view is based on the Enable default table view setting on the Administration tab.
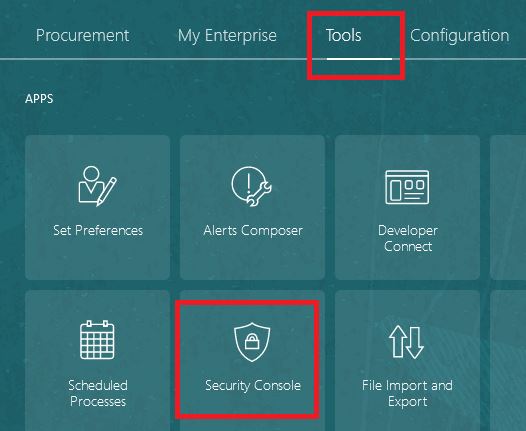
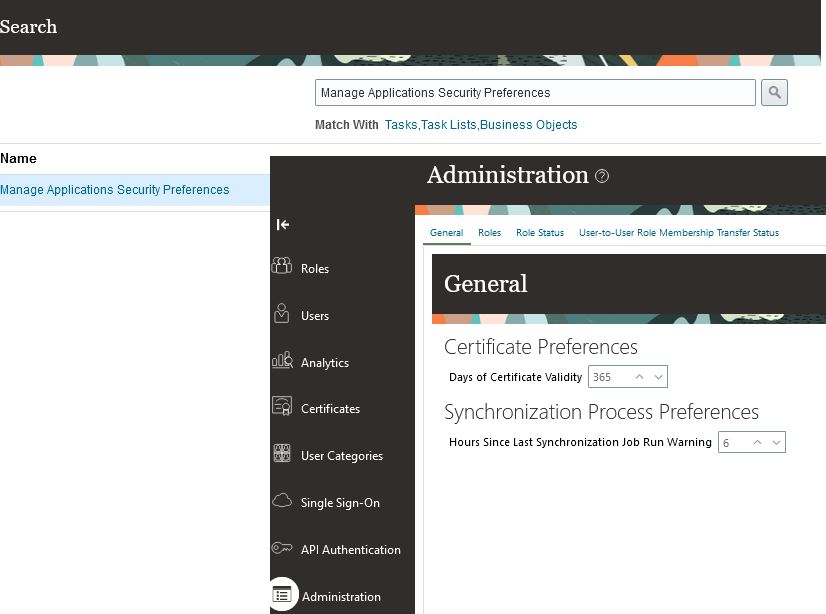
Navigate to Tools >> Security or open the task Manage Applications Security Preferences task from Setup and Maintenance >> Search tasks option.
Navigate to Roles:
The Tabular View
If the tabular view doesn’t display when you select Roles tab, simply click the View as Table icon (Tabular View in above image). In this view, you’ll be able to:
-
View the full role hierarchy for a selected user or role. The table displays roles that are inherited both directly and indirectly.
-
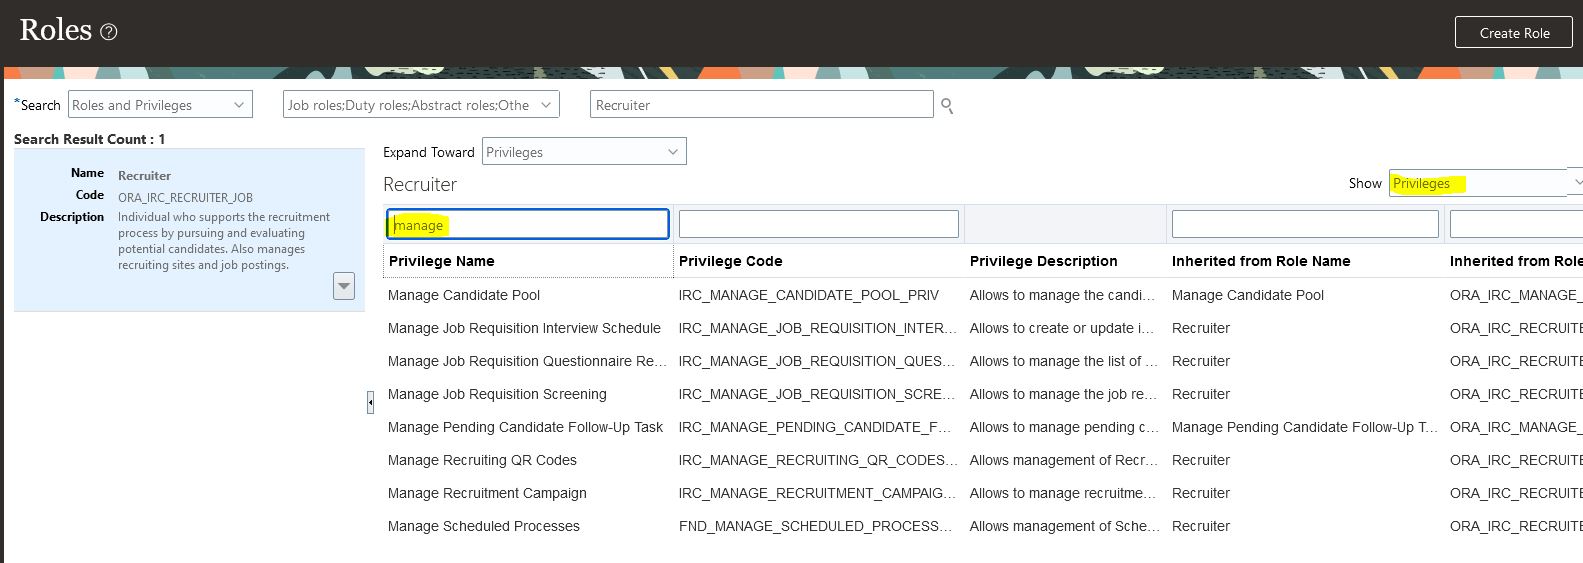
You can search for a security artifact by entering a search term in the column search field and pressing Enter.
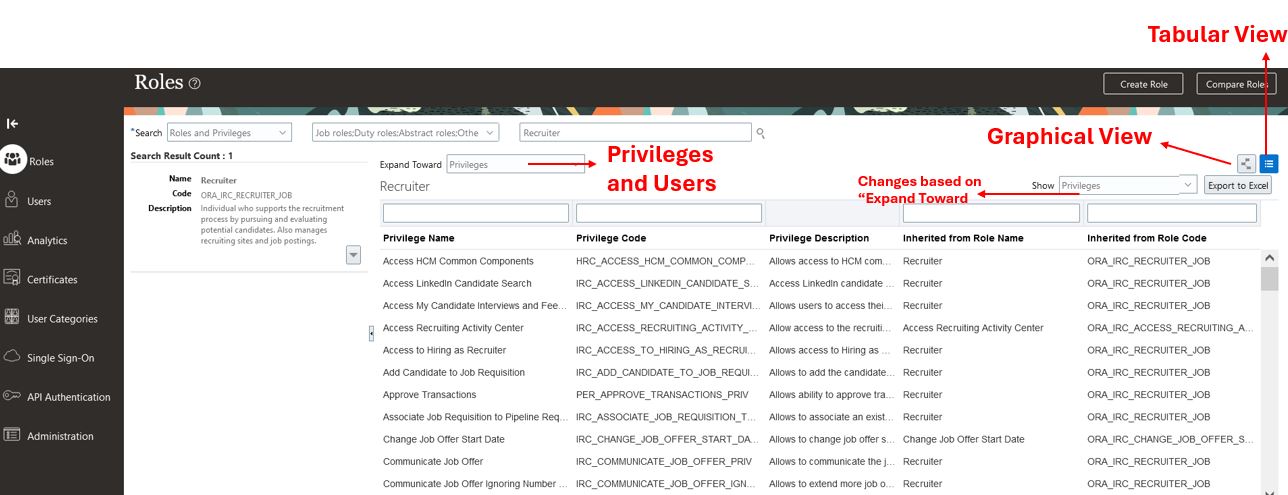
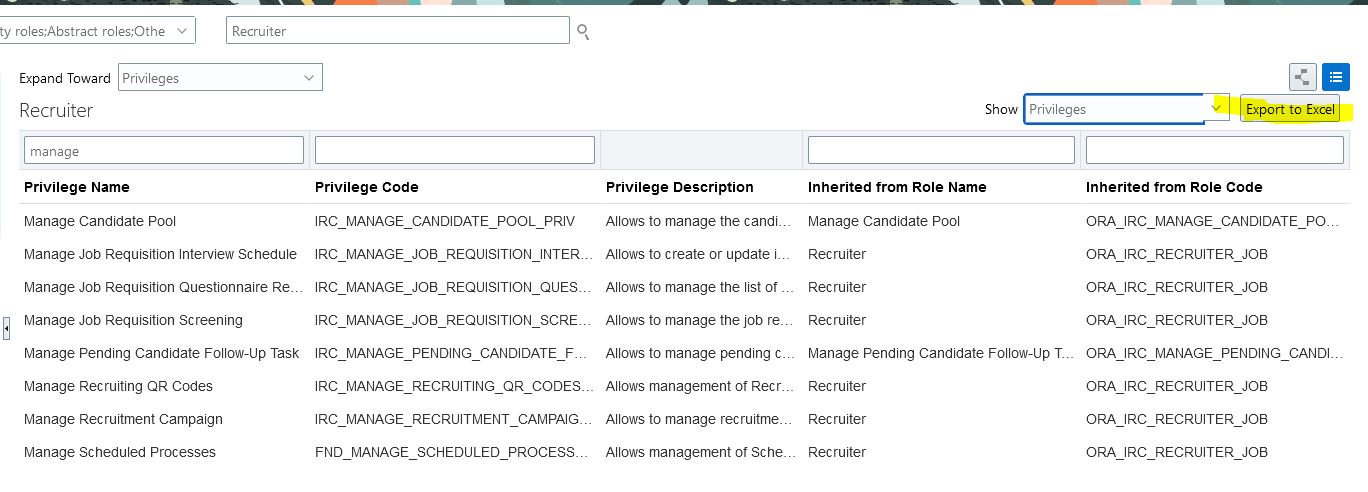
- If Expand Toward is set to Privileges, then you can set Show to either Privileges or Roles. In this view you can see the privileges and roles assigned to a particular role.
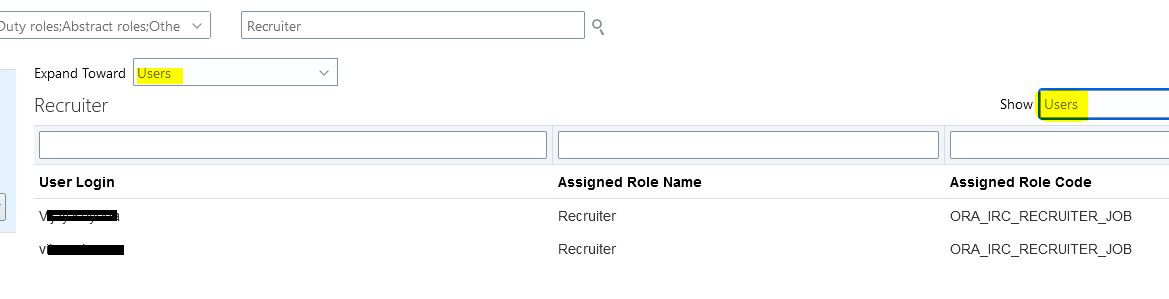
- If Expand Toward is set to Users, then you can set Show to either Roles or Users. Users will show all the users assigned to this role.
- You can also export the displayed details to a Microsoft Excel spreadsheet.
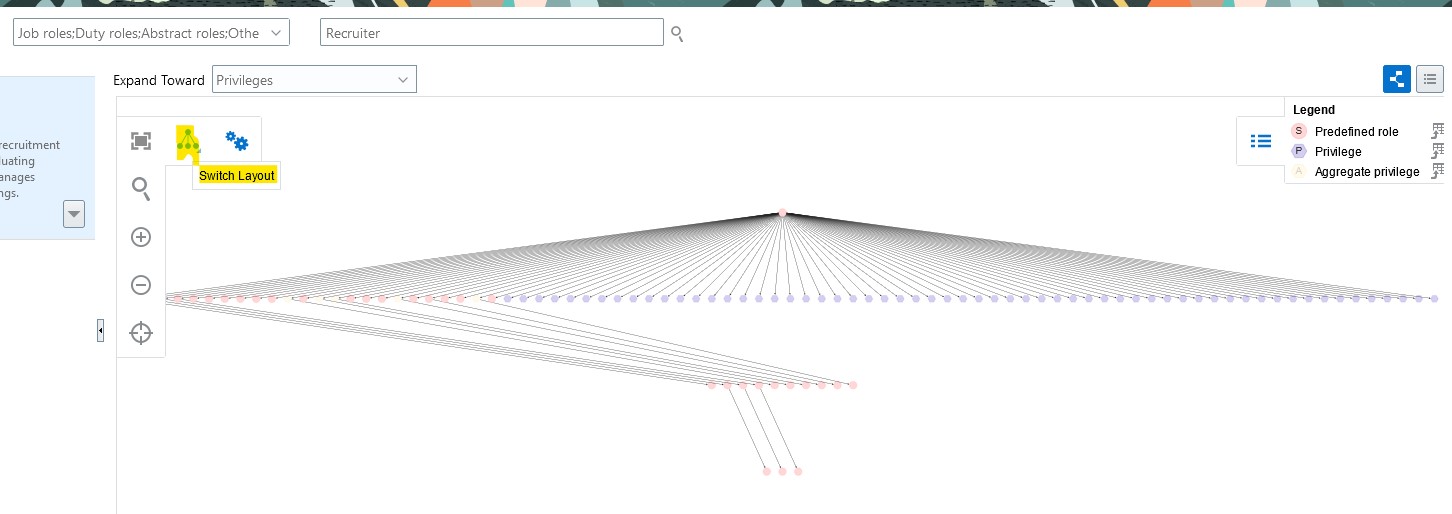
The Graphical View:
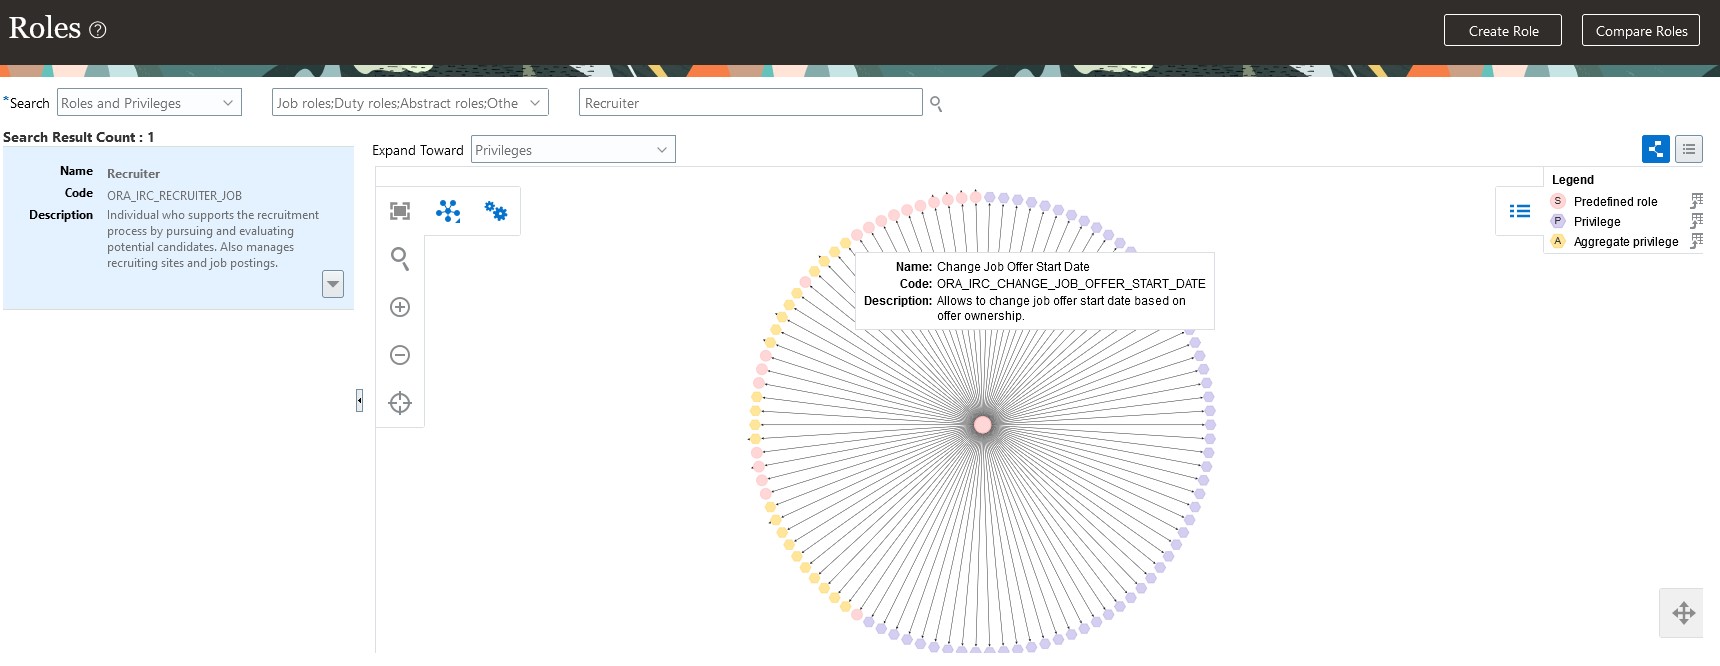
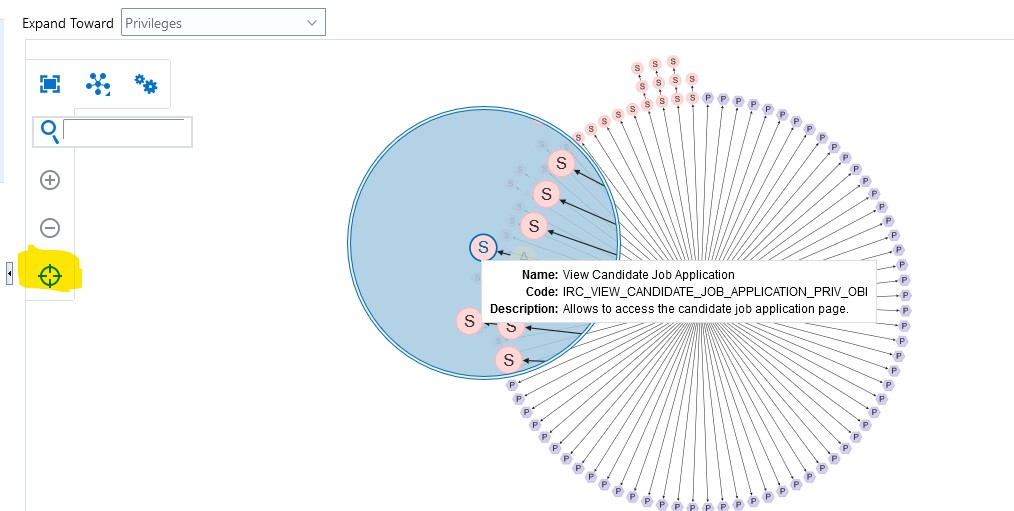
If the graphical view doesn’t appear when you select Roles tab, then you can click the Show Graph icon (Graphical View in image# 2). In the graphical view, users, privileges, and different types of roles are displayed as nodes, with each type distinguished by colors and labels. These values are defined in the Legend. You can:
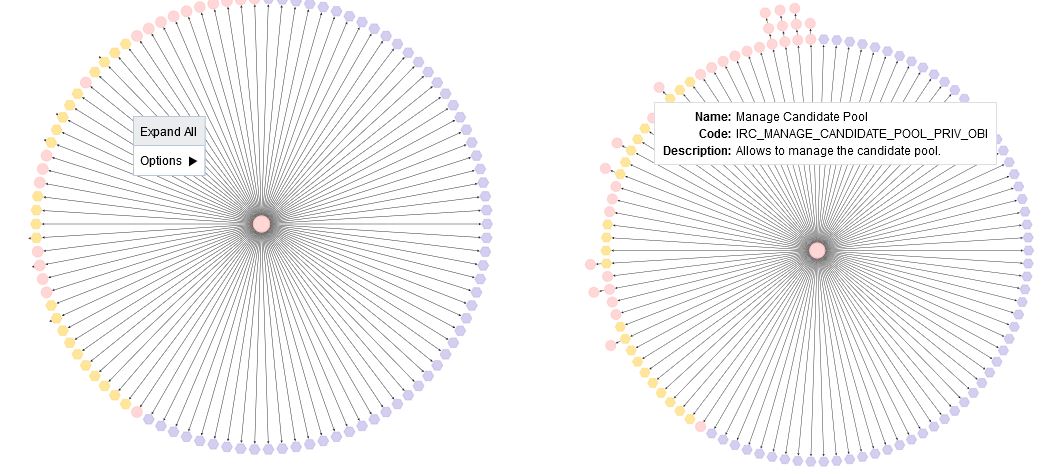
- Examine the roles that are directly inherited by the selected role or user. To view roles and privileges that are inherited indirectly, right-click, and choose either Expand or Expand All. You can reverse this action by selecting Collapse or Collapse All. Additionally, you can double-click a node to expand or collapse it.
- Use the Set as Focus action to make any selected node the center of the visualization.
- Use the Overview icon to manipulate the visualization. For example, clicking a node in the Overview moves the node to the center of the visualization. You can also use drag and drop.
- Hover on a legend entry to highlight the corresponding nodes in the visualization. Click a legend entry to add or remove corresponding nodes in the visualization.
In the Control Panel, you can:
- Switch the layout between radial and layered representations.
- You can also Zoom in and out using either the Zoom in and Zoom out icons or the mouse wheel.
- Magnify areas of the visualization by clicking the Magnify icon and dragging it to the area of interest. Click the icon again to switch it off.
- Click the Zoom to Fit icon to center the image and fill the display area.
References:
** Oracle Document URL is subject to change with every upgrade.